Currently, TSLA appears to be going through a deep pullback within a broader bullish trend.
On the 1H chart, the correction phase is already becoming more noticeable. RSI has entered oversold territory, but price action continues to look weak, while MACD sell momentum is expanding. Short-term moving averages are also starting to turn into resistance levels one by one.
On the other hand, the 4H chart still maintains a bullish moving average alignment, so the higher timeframe trend itself has not completely broken down yet. However, there are still very few signs of RSI recovery, and MACD also looks like it is transitioning from fading buy momentum into the early stages of sell momentum.
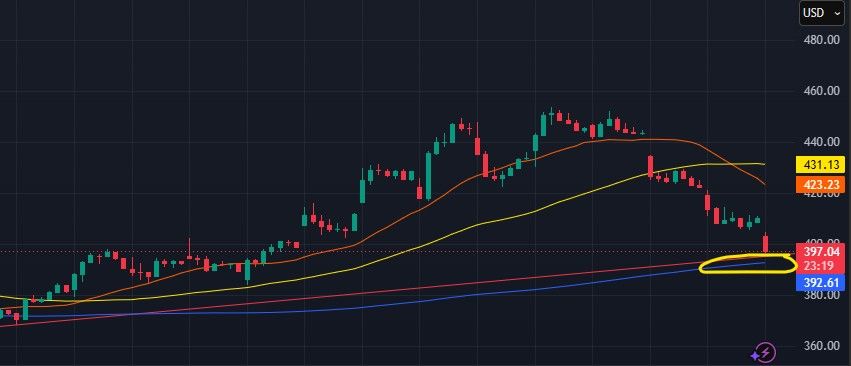
At this point, the key area to watch is the short-term rising trendline along with the EMA support zone around $390–392. The May 6 gap has also been mostly filled, so rather than expecting immediate bullish continuation, it may be more important to watch how the structure develops after this pullback phase.
현재 TSLA는 강한 상승 추세 안에서 deep pullback이 진행되는 모습에 더 가까워 보인다. 1시간봉에서는 이미 조정 흐름이 강하게 나타나고 있다. RSI는 과매도 구간에 들어왔지만 계속 약한 흐름이 이어지고 있고, MACD sell momentum도 확장되는 중이다. 단기 이평선들도 하나씩 저항으로 바뀌는 모습이 보인다. 반면 4시간봉은 아직 정배열이 유지되고 있어서, 상위 추세 자체가 완전히 무너진 상태는 아니다. 다만 RSI 반등 기미가 거의 없고, MACD 역시 이제 매수 momentum이 끝나면서 sell momentum 진입 직전 구간처럼 보인다. 지금은 붉은 단기 상승 추세선과 390~392 부근 EMA 지지 영역에서 가격이 어떤 반응을 보여주는지가 중요해 보인다. 5월 6일 부근 갭도 어느 정도 메워진 상태라, 당분간은 바로 continuation이 나오기보다는 조정 이후 구조가 어떻게 형성되는지 조금 더 지켜볼 필요가 있어 보인다.