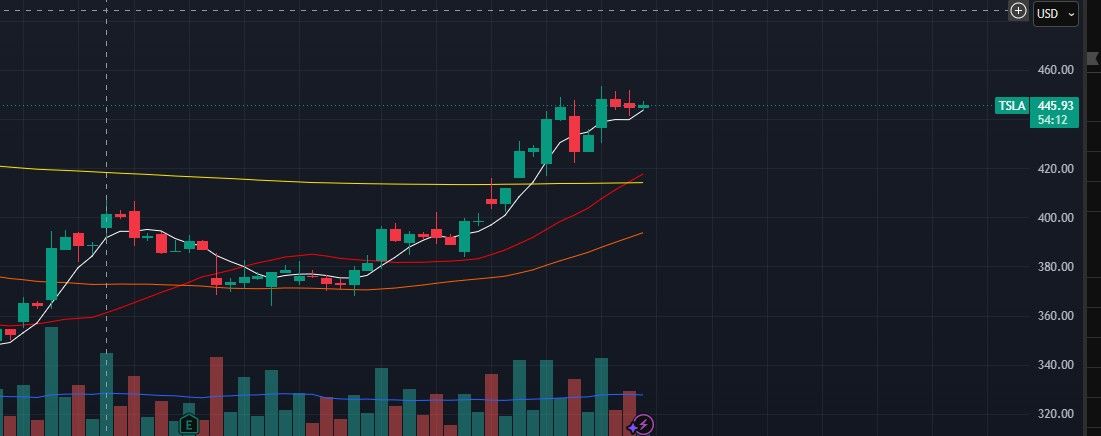
TSLA moved up aggressively in a short period of time, but momentum is starting to slow down.
4H RSI is still overbought above 70, and historically TSLA usually does not stay overbought for long without some type of pullback or reset. Sometimes it pulls back toward RSI 50 and continues higher, other times it resets much deeper before continuing.
On the 1H chart, RSI structure started weakening with lower highs/lower lows, MACD histogram is shrinking, and ATR started curling down after expanding during the rally. That suggests bullish momentum is losing strength.
At the same time, overall higher timeframe structure is still bullish. EMAs are still aligned upward and there is no confirmed higher timeframe lower high/lower low breakdown yet.
My current expectation is that TSLA may need a healthy pullback or consolidation, possibly toward the 200 EMA area, before attempting another strong move higher.
TSLA가 짧은 시간 안에 강하게 상승했지만, 현재는 모멘텀이 조금씩 둔화되기 시작하는 모습이다.
4시간봉 RSI는 아직 70 이상 과매수 구간에 있으며, 과거 TSLA 흐름을 보면 과매수 상태를 오래 유지하기보다는 어느 정도의 pullback이나 reset이 자주 나왔었다. 어떤 경우에는 RSI 50 부근까지 식히고 다시 상승했고, 어떤 경우에는 더 깊게 조정 후 다시 상승했다.
1시간봉에서는 RSI 구조가 lower high / lower low 형태로 약해지기 시작했고, MACD 히스토그램도 줄어들고 있으며, ATR 역시 강한 상승 이후 위에서 꺾이기 시작했다. 이는 상승 모멘텀의 힘이 점점 약해지고 있다는 신호로 해석할 수 있다.
다만 아직 전체 상위 타임프레임 구조 자체가 완전히 무너진 것은 아니다. EMA 정렬도 아직 상승 구조를 유지하고 있고, higher timeframe 기준으로 명확한 LH/LL 구조 전환도 아직 나오지 않았다.
현재로서는 TSLA가 다시 강하게 상승하기 전에 200EMA 부근이나 주요 지지 구간까지 건강한 pullback 또는 consolidation 과정을 거칠 가능성이 있다고 생각한다.